For many, the tradeoff between space and cost is a deciding factor on where they choose to settle down. Should you buy a tiny studio in Manhattan or a large townhouse in Atlanta? The reality is that living in certain places often means downsizing your expectations.
But we at RealtyHop wondered just how drastic these tradeoffs are between cities. Could there be hidden gems where you wouldn’t have to sacrifice size for desirability? To find out, we calculated the amount of square footage you’d be able to buy in every major city in the country at the current U.S. national median home sales price of $350K.

Key Findings
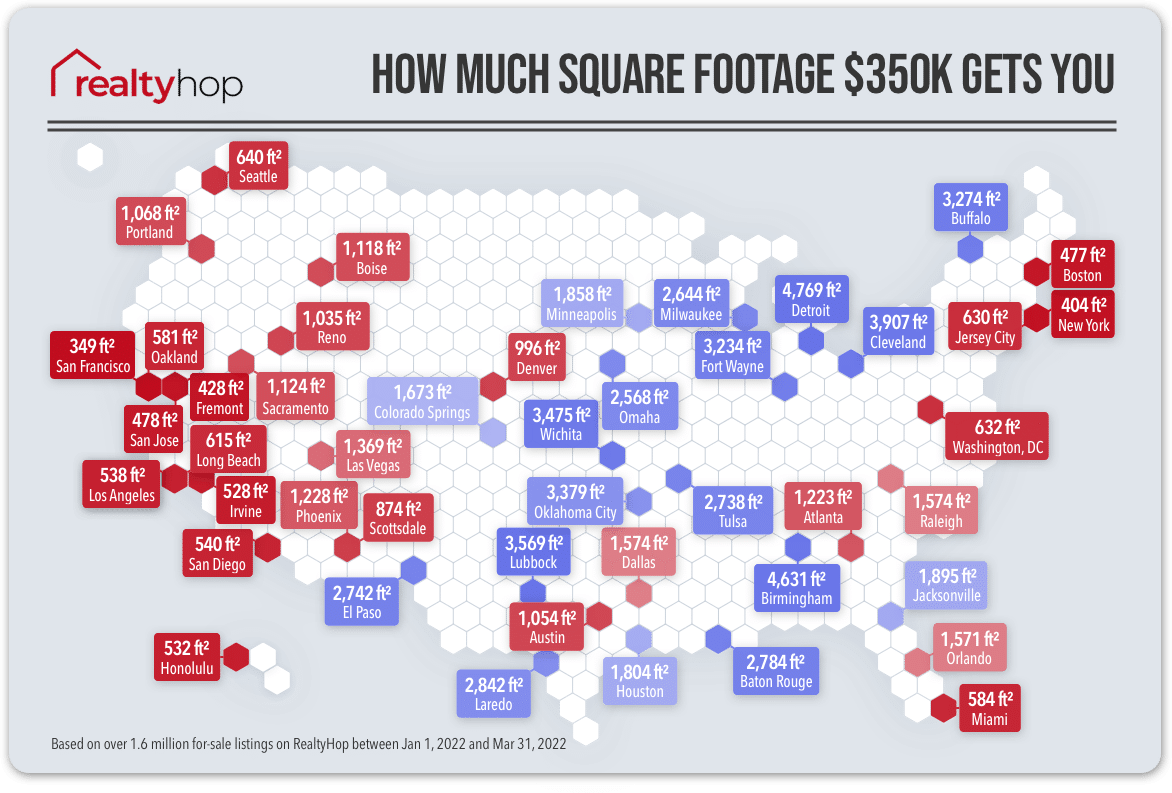
- At the current national median home price of $350K, San Francisco gets the least space at 349 square feet, while Detroit gets the most at 4769 square feet.
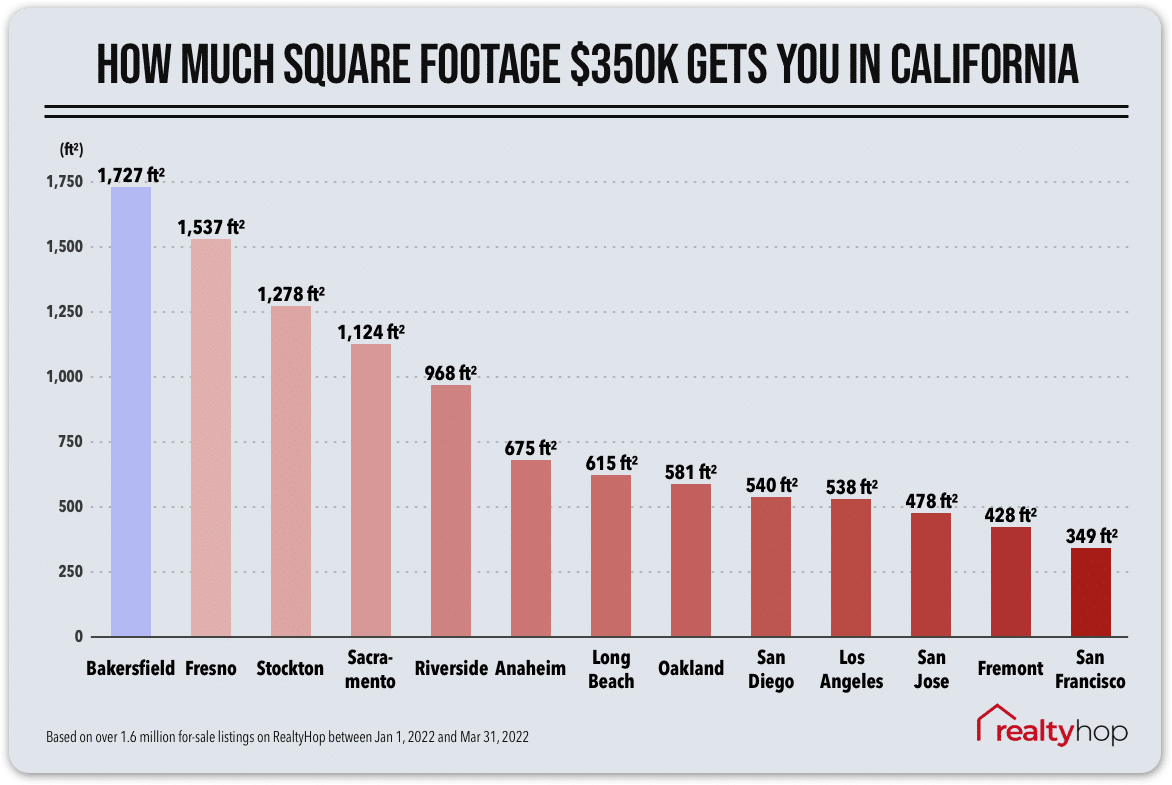
- California is the most space-constrained state. 7 out of the top 10 cities with the most expensive price per square foot are located in California.
- There are still many desirable cities offering affordable square footage. At the national median price, highlights include San Antonio at 2116 square feet, Houston at 1804 square feet, Tucson at 1755 square feet, and Colorado Springs at 1637 square feet.

Cities where you get the most space for $350K
1. Detroit, MI – 4769 square feet
Looking for the most space for your dollar? Detroit is the place for you. The city has the cheapest price per square foot of any metro area in the United States at $73.39, meaning that the current median home price of $350K would buy a massive 4769 square foot property.
2. Birmingham, AL – 4631 square feet
Birmingham isn’t far behind, coming in as the second cheapest price per square foot at $75.58. At this rate, a buyer with $350K could get over 4631 square feet of property in the city limits.
3. Cleveland, OH – 3907 square feet
If you’ve dreamt of a large home for a reasonable price, Cleveland is another top contender. At just under $90 per square foot, a $350K property in the city would mean 3907 square feet of living space. This is about 10x more space than a similarly priced property in New York City.
4. Lubbock, TX – 3569 square feet
For the national average, a buyer in Lubbock could get 3569 square feet of property given a reasonable price per square foot of $98.
5. Wichita, KS – 3475 square feet
Wichita is another great option for those looking for a great deal on space. At $100 per square foot, the city was the fifth most affordable and would net you a 3475 square foot property at the national average.

Cities where you get the least space for $350K
1. San Francisco, CA – 349 square feet
At over $1,000 per square foot, a $350K property in San Francisco would get you a tiny 349 square feet of living space. While this sounds crazy, certain SF residents have found ways to make it work.
2. New York, NY – 404 square feet
It’s no surprise to those living in New York that a $350K budget would get very little. But, at over $867 per square foot, the 404 square feet of living space one could get does sound a bit extreme.
3. Fremont, CA – 428 square feet
Similar to neighboring San Francisco, Fremont has some of the most expensive space in the country at $817 per square foot. At the current national home average, a new buyer would only be able to snag a tiny 428 square feet.
4. Boston, MA – 477 square feet
Boston is the fourth most space-constrained city, with the national average home price buying only 477 square feet of space. This comes out to a price per square foot of over $733.
5. San Jose, CA – 478 square feet
San Jose rounds out our top five cities where you get the least space for your buck. This Bay Area tech city has a price per square foot of $731, meaning you’ll be only able to purchase a meager 478 square feet of space for $350K.
Methodology & Limitations
Methodology
To create this report, we analyzed home price data taken from over 1.6 million listings on RealtyHop between Jan 1, 2022, and Mar 31, 2022. Listings included residential single-family homes, condos, co-ops, and townhouses actively on the market, but excluded those that did not list square footage.
To calculate the median price per square foot, we divided each listing’s price by its total square footage. These statistics were then aggregated based on the area, with the median taken for each city.
We used the National Association of Realtors’ latest January 2022 median existing-home sales price of $350K to calculate the square footage one could purchase at that price.
Limitations
While we’ve used the citywide median price per square foot in our calculations, one limitation of our study is that this statistic is usually not uniform across a city. Our findings are meant to paint a picture of the differences across cities (and broadly within a city), and not meant to dictate the exact properties you could buy at any given price and size.
Have questions or comments about this report? Reach us at [email protected].
